Working with Embedded Wizard: Prototyping and debugging
Embedded Wizard contains an integrated prototyping environment that makes it simply to test the function of individual GUI components as well as the complete application instantly while you work on your project. In the case, the implementation doesn't behave as expected the prototyping environment helps you also to debug and analyze the reasons for the incorrect functionality.
Internally, the prototyping environment includes a virtual machine, a kind of interpreter for the Embedded Wizard own programming language Chora. Thanks to this virtual machine the prototyping environment is able to evaluate and execute your implementation without the necessity to use any external compiler or other development tools. In other words, you can start and test the components directly within Embedded Wizard Studio.
Prototyper window
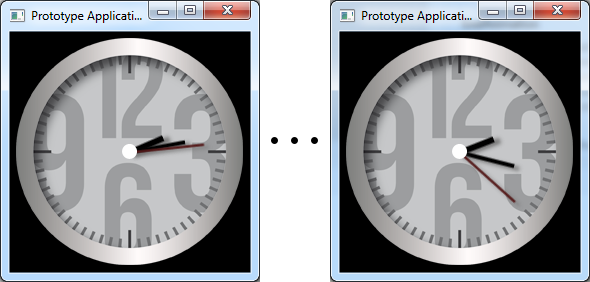
When you start the prototyping, Embedded Wizard opens the Prototyper window. You can imagine, this window represents the display in your final product. Now you can interact with the Prototyper by using the keyboard and the mouse device similarly as you will do with hardware buttons or touchscreen available in your product. If the component implements animations, the animations are executed accordingly, for example a clock is updated automatically:
You have two options to start the prototyping to test the currently edited GUI component or to test the complete application.
Composer Canvas area
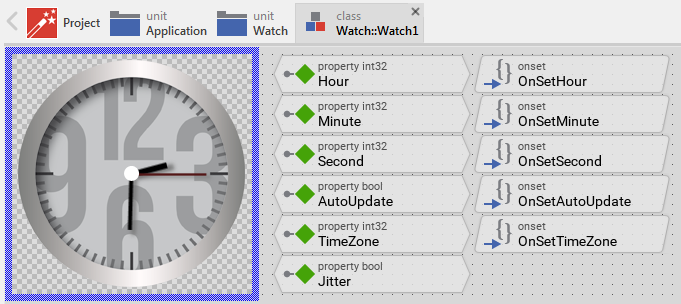
As you remember, when editing a GUI component you compose its appearance from views, which you simply add and arrange inside the Canvas area. To present those views, the Canvas uses internally its own prototyping environment. Thereupon, what you see in the Canvas area are instances of the respective view and component classes instantiated and brought to life:
This is in so far important as modifying a view at the design time causes the code belonging to this member being executed similarly as it is the case when the member is modified at the runtime. For example, if you grab and move in the Canvas area a Filled Rectangle view, its property Bounds is modified and the corresponding onset method is executed triggering the screen update process, which finally redraws all the affected parts of the Canvas area.
The code you have eventually implemented for your particular component interfaces or to manage the component state is similarly executed when the corresponding members are modified during the design phase. You can imagine, that all graphical objects you see in the Canvas area as well as the GUI component you are currently editing are living objects.
IMPORTANT
From this fact arises the potential problem of error handling in the Canvas area. When your implementation is incorrect, the prototyping environment will report Chora errors or your components will appear and behave unexpectedly. In such case you will need to debug your implementation.
Select profile, language and styles
In the upper area of the Embedded Wizard window you see the Build toolbar. This toolbar contains various comboboxes to conveniently switch between profiles, languages and styles available in your project:
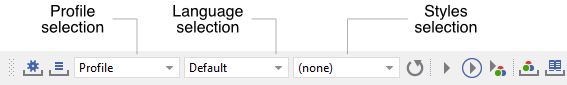
Here changing the selection affects immediately the content shown actually in the Canvas area. For example, if your GUI application is localized for various languages and you use the second combobox to switch the language, the Canvas will instantly update all displayed text fragments to match the newly selected language. Similarly, the actual combobox selection determines the initial condition when you start a new prototyping session. This means, the Prototyper window will appear with the latest selected language.
The three comboboxes are thus very convenient when while developing a GUI component you want to test how it will appear and behave with the particular language, style or profile selected.
Debug code step by step
The menu Debug provides commands to toggle breakpoints and execute the code step by step when during working with the Prototyper window one of the breakpoints has been reached. The following table provides a short overview of the most important commands:
Command |
Description |
|---|---|
With this command you can set or remove a breakpoint in the Code Editor at the text row containing the blinking caret. |
|
Resumes the previously paused code execution until the next following statement in the current method is reached. |
|
Resumes the previously paused code execution for a single statement only, then it pauses the execution again. |
|
Resumes the previously paused code execution until the current method is finished. |
|
Resumes the previously paused code execution until the next statement is reached, however, without stopping at statements resulting from initialization expressions specified in the Inspector window. |
|
Resumes the previously paused code execution until the next breakpoint has been reached. |
|
Aborts the further execution of the currently paused code. |
|
Pauses the actual code execution in the Prototyper. Thereupon you can e.g. evaluate the existing Chora objects or analyze the memory usage. |
Use Debugger windows
While the Prototyper window pauses the execution you can inspect the current state of the tested component conveniently. Embedded Wizard provides for this purpose various Debugger windows, which appear automatically when the execution is interrupted. The following table provides a short overview of the available windows:
Window |
Description |
|---|---|
Provides a view of all operands used in context of the current and the immediately preceding statements. As such it is useful to inspect variables and objects. |
|
Provides a view at the stack with all nested method invocations leading to the current statement and at variables existing in the contexts of the respective methods. As such it is useful to evaluate from whom a method has been called and to inspect variables used in the particular methods |
|
Provides a view of all currently existing dynamically created objects together with the location where the particular object has been originally created. As such it is useful to get an overview about the object stock and to inspect the contents of existing objects. |
Use the Memory (RAM) usage window
The Memory (RAM) usage window provides a view on the stock change of all objects created dynamically during the active Prototyper session. As such it is useful in order to monitor how the number of existing objects raises and declines while you test a GUI component.
Force the Garbage Collector to run
With the menu command Force garbage collection you can trigger the Prototyper to run a new garbage collection cycle. The resource management of Embedded Wizard applications is based on a Garbage Collector which periodically and automatically detects and releases unused resources.
Usually, in the target system, the Garbage Collector is activated after every screen update. The Prototyper, in turn, runs the Garbage Collector every 0.25 .. 10 seconds depending on the number of Chora objects created in the meantime. Activating this command permits you to run it more frequently. You can observe the effect of the garbage collection in the Memory (RAM) usage window.
Use trace and tracestack statements
With the trace statement you can simply print variables and results of expressions. If you are familiar with C programming language, this statement can be compared with the C function printf() or in case of JavaScript with console.log(). Similarly with the statement tracestack you can print the actual callstack history. All outputs appear in the Log window chronologically in the order in which the statements were executed.
Track screen updates
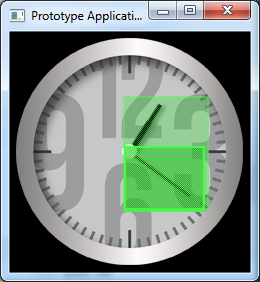
During an active prototyping session you can track screen changes. If enabled, the Prototyper highlights every redrawn screen area for a short period. This function can help you to analyze and optimize the screen updates in your GUI application:
★To enable/disable the function select the menu item before you start a prototyping session.
When the application hangs?
If you can neither control the tested GUI component nor interact with the Embedded Wizard Studio, then certainly the execution of the GUI component has entered an endless loop. In order to obtain back the control, try following:
★With the mouse click on the close button in the upper-right corner of the Prototyper window.
★Double-click within the Prototyper window.
This should cause the Prototyper to pause with the current code line shown in the Code Editor. Now you can investigate the reason for the endless execution using the integrated Debugger windows.
Clicking again on the close button of the Prototyper window, will terminate the current prototyping session.