Embedded Wizard Studio: Callstack window
The Callstack window appears when the prototyping session is paused. It provides a view at the stack with all nested method invocations leading to the current statement and at variables existing in the contexts of the respective methods. As such it is useful to evaluate from whom a method has been called and to inspect variables used in the particular methods while debugging step-by-step the implementation of your GUI components:
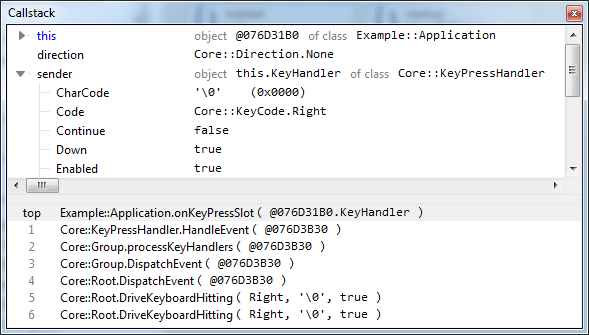
Callstack window while debugging an application
Show the Callstack window
The Callstack window appears automatically when the running prototyping session is paused. However, if you have previously hidden the window, you can show it again by using the shortcut Alt7 or the menu item .
Callstack area
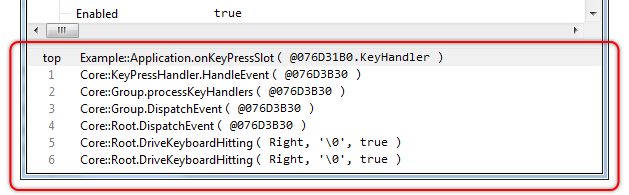
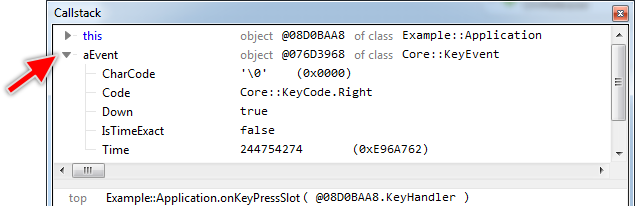
The lower part of the window presents a list with all currently nested methods. The entry on the top corresponds to the last called method - it is in fact the top of the stack. The methods are displayed with the arguments passed in at the time the respective method was originally invoked. In this area you can evaluate and inspect the call history:
Variables area
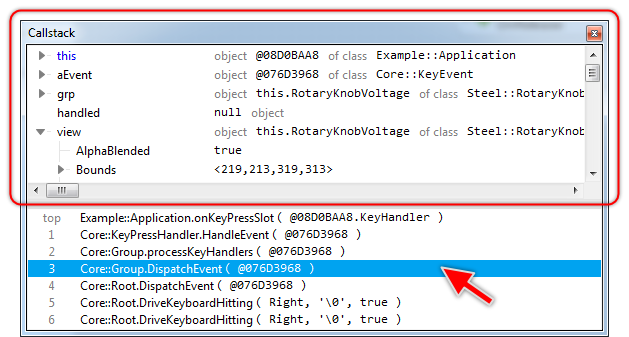
The upper part of the window displays all operands existing in the context of the method, which is currently selected in the window's lower callstack area. In particular it includes the latest values of all local variables and arguments as well as the object this in context of which the selected method has been called. In this area you can inspect the values of the respective operands:
Navigate between areas
You can toggle between the upper and the lower part of the window by using the shortcut CtrlTab.
Inspect call history
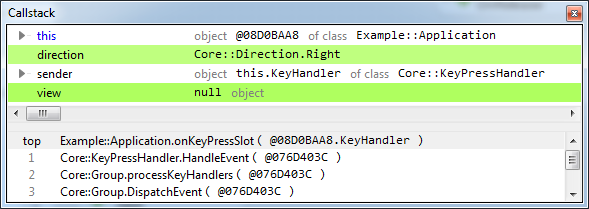
You can navigate in the lower callstack area and inspect the methods listed there. This in turn causes the upper variables area to be reloaded with operands belonging to just selected method:
★To navigate in the callstack area use the keys Up and Down.
For every method listed in the callstack area you can additionally inspect the corresponding location in the Code Editor:
★To show the location in the Code Editor double click on the affected method
★... or press the key ENTER while the method is selected in the list.
Inspect values
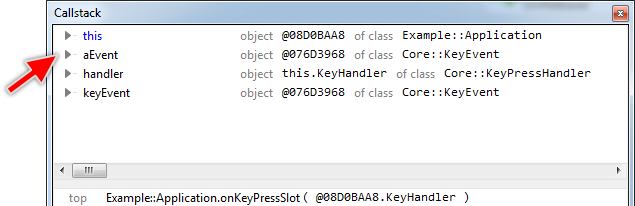
The upper part of the window shows a list with operands and their respective contents. You can navigate in the list and inspect the individual values. Depending on the type of an operand, you can also expand it and inspect the contents embedded inside it. For example, you can see the data members of an object:
★To navigate in the variables area use the keys Up and Down.
★To expand an operand just click on the triangle  found on the left of the operand
★... or press the key Right while the affected item is selected.
★To collapse an operand just click on the triangle  found on the left of the operand
★... or press the key Left while the affected item is selected.
Track changes
The Callstack window detects when during debugging the operands listed in the variables area are modified and highlights automatically the affected items with green color. This color fades out with time allowing you to simply distinguish which variable has changed recently:
Object naming
Depending on the parentage of an object the Callstack window uses different notations to identify it. In particular the instance this (the object in context of which the method is executed) is represented by a homonymous identifier this:

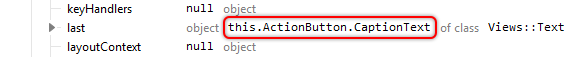
An embedded object is identified by its name you have originally specified in the implementation. If an object is nested inside another embedded object, it is identified by the complete path composed of all affected object names and separated by the . (dot) sign:
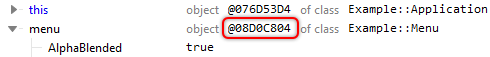
If the object was created dynamically by using the new operator, then the object is identified by a unique 32-bit hexadecimal number starting with the @ (at) sign. As long as the object exists this number remains valid:
In turn, a globally existing autoobject is identified by the name of the unit containing the respective autoobject and the name of the autoobject itself starting with the @ (at) sign. For example, the autoobject Example::PowerSupply is shown in the Callstack window as follows:

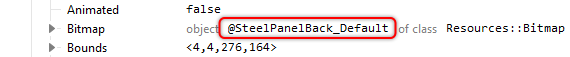
Bitmap and font resources are identified similarly with the additional language variant name, separated by a _ (underscore) sign. For example, the instance of the bitmap resource Steel::PanelBack in its default language variant is shown in the Callstack window as follows:
Memoryless properties
The variables area of the Callstack window displays only the contents stored within the memory associated to the listed operands. This can be confusing when the affected operand is a property implementing its own onget method. When you inspect a property in the Callstack window the code of such onget methods is never executed in order to avoid potential interferences with the debugged application.
The Callstack window limits to show what the memory behind the property does contain. This can in fact differ from the value calculated dynamically by the onget method of the affected property.
Hide the window
The Callstack window disappears automatically as soon as the prototyping session is resumed or terminated. If desired however, you can hide this window temporarily and so uncover the screen areas lying behind it.
★To hide all debugging windows press the key F6
★... or select the menu item .
To show the windows again simply repeat this operation.