Menu and Toolbar: Debug
The menu and the corresponding toolbar contain commands for prototyping and debugging:
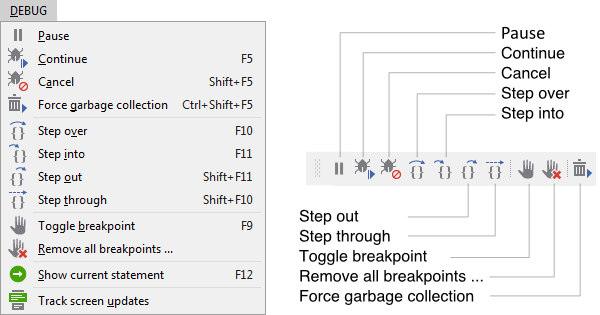
The menu and the corresponding toolbar
Pause
This command pauses the actual code execution in the Prototyper. Thereupon you can e.g. evaluate the existing Chora objects in the Chora Objects window or analyze the memory usage in the Memory (RAM) usage window.
Continue
This command resumes the previously paused code execution in the Prototyper. The Prototyper pauses the execution usually at a breakpoint, when a runtime error is raised or explicitly when the user has selected the command Pause.
Cancel
This command aborts the further execution of the currently paused code in the Prototyper. The Prototyper pauses the execution usually at a breakpoint or when a runtime error is raised.
Embedded Wizard created applications are event driven. They react to user inputs, system and timer events. Activating this command terminates immediately the processing of the current event. This can be useful when you during debugging detect, that, e.g., the current execution stucks in an endless loop. After aborting the current event execution, the Prototyper will continue with the next event, if any is available.
Force garbage collection
With this command you can trigger the Prototyper to run a new garbage collection cycle. The resource management of Embedded Wizard applications is based on a Garbage Collector which periodically and automatically detects and releases unused resources.
Usually, in the target system, the Garbage Collector is activated after every screen update. The Prototyper, in turn, runs the Garbage Collector every 0.25 .. 10 seconds depending on the number of Chora objects created in the meantime. Activating this command permits you to run it more frequently. You can observe the effect of the garbage collection in the Memory (RAM) usage window.
Step over
This command resumes the previously paused code execution in the Prototyper until the next following statement in the current method is reached. All eventually nested method invocations are executed before the Prototyper pauses again. This command is useful when you intend to execute a method step-by-step.
Step into
This command resumes the previously paused code execution in the Prototyper for a single statement only, then it pauses the execution again. In other words, if the executed statement involves an invocation of a method, the execution will pause just before the first statement of this method. This command is useful when you intend to execute the code step-by-step.
Step out
This command resumes the previously paused code execution in the Prototyper until the current method is finished. All eventually nested method invocations are executed before the Prototyper pauses again. This command is useful when you want to continue the debugging in the calling method.
Step through
This command resumes the previously paused code execution in the Prototyper until the next statement is reached, however, without stopping at statements resulting from initialization expressions specified in the Inspector window. This command is useful when you focus the debugging on the code implemented within methods only.
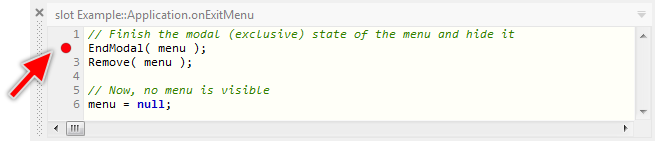
Toggle breakpoint
With this command you can set or remove a breakpoint in the Code Editor at the text row containing the blinking caret. At the runtime, the Prototyper pauses the execution when a breakpoint is reached. Breakpoints are thus very useful when you intend to debug the code in the affected row. In the Code Editor breakpoints are displayed as small red dots on the left of the affected text row:
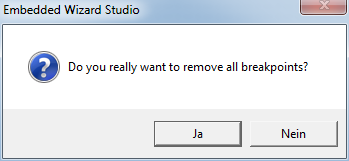
Remove all breakpoints ...
With this command you can remove all breakpoints at once in your application. This is very useful, when after completing the debugging you want to run the application without pauses. Before removing all breakpoints Embedded Wizard will request you to confirm this operation:
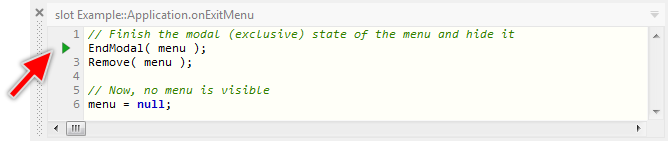
Show current statement
With this command the location where the Prototyper code execution currently pauses is shown in the Code Editor or Inspector window. If the affected window is currently hidden, the window will become visible first. In Code Editor, the text line with current statement is decorated with a small green triangle:
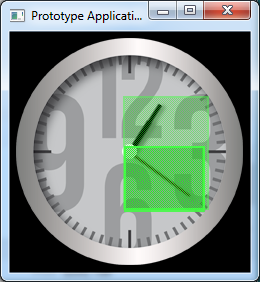
Track screen updates
This command determines whether the Prototyper should highlight the redrawn screen areas. This function can help you to analyze and optimize the screen updates in your GUI application. If enabled, the Prototyper overlays the redrawn screen areas with green color, which after a short period is faded out again: